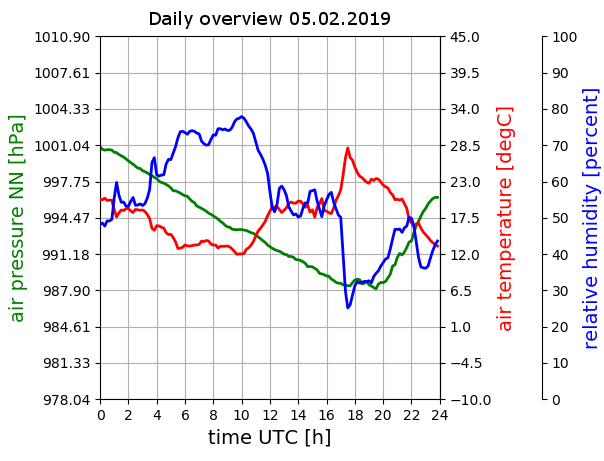
During the first days of this week, we had quite special meteorological conditions at Punta Arenas. Persistent wind from the north brought unusually warm air to the Magallanes region. Together with the absence of clouds and hence strong heating by the sun, surface temperatures climbed to extraordinarily high values. On Monday (4 Feb), the maximum temperature at Punta Arenas airport reached almost 25°C and on Tuesday the maximum was 28°C. Long-term temperature records were set for several other stations throughout the region, as for example Porvenir and Puerto Natales with both above 30°C (https://twitter.com/meteochile_dmc/status/1092808761167831040). On Tuesday evening, the heat period came to a sudden end, when a cold front arrived. This is nicely visible in the surface observation (at the UMAG roof platform, shown below) as temperature drops by 15°C (red curve) and pressure increases (green curve) after 17:30 UTC (14:30 local). A nice feature is also the jump in temperature and drop in relative humidity (blue curve) directly before the front, which is probably caused by Föhn effects as the wind increased and backed toward westerly directions.
But the airmass from the north did not only bring high temperatures, but aerosol as well. Our lidar PollyXT (see also prior blog posts here and here) detected several lofted layers between 1 and 5km height on Monday and Tuesday. Several plumes are visible in the backscatter signal. One with rather weak backscatter and low depolarization ratio on Tuesday and another one with higher backscatter and some features with higher depolarization ratio.
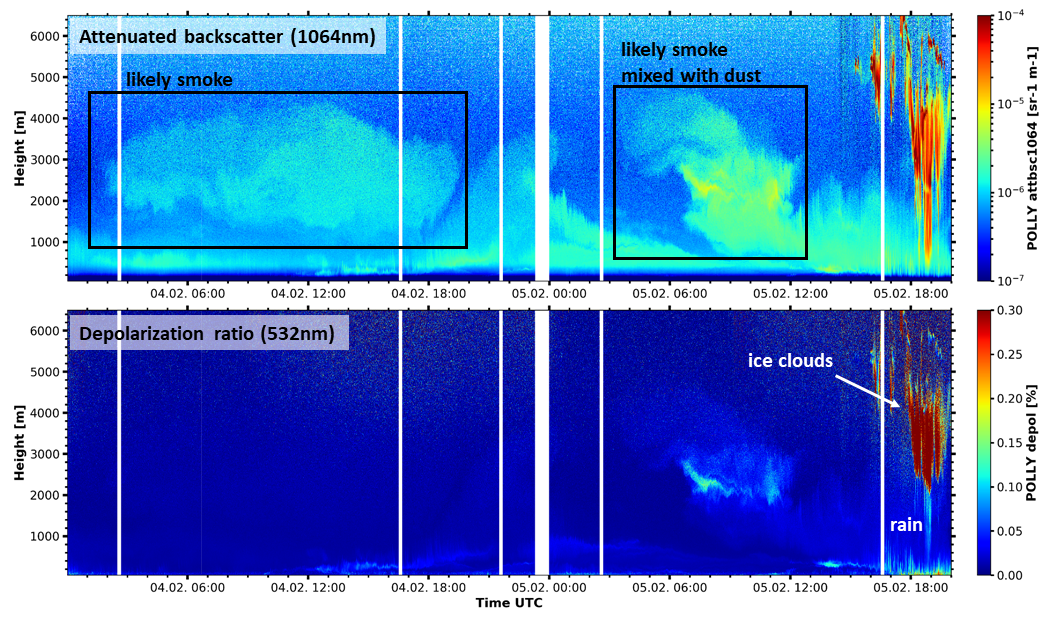
The aerosol optical depth, a measure for total aerosol load in the atmosphere, reached values up to 0.1 (at a wavelength of 500nm). The spectral dependence between 440 and 870nm (called Ångström exponent) was around 1.5, indicating predominantly small particles with a diameter well below 1μm. Based on their optical parameters these particles are most likely smoke caused by wildfires, on Tuesday maybe mixed with some soil dust.
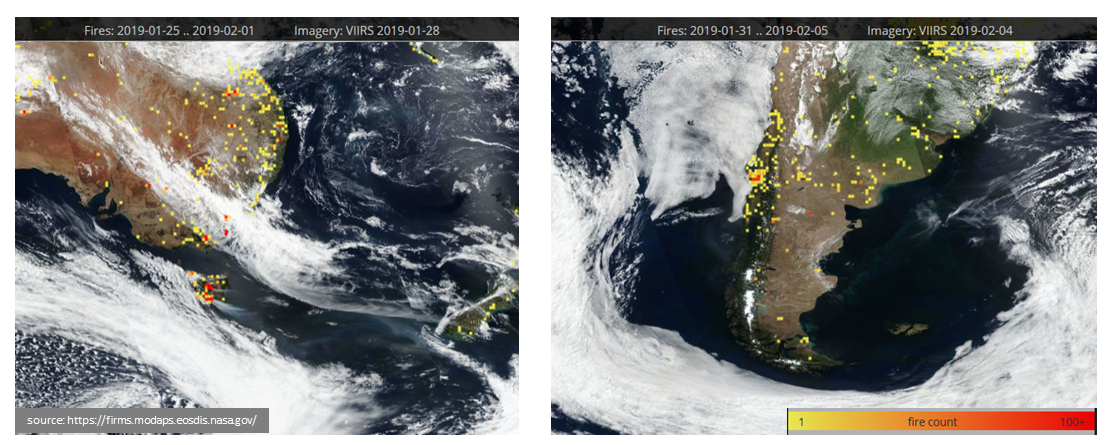
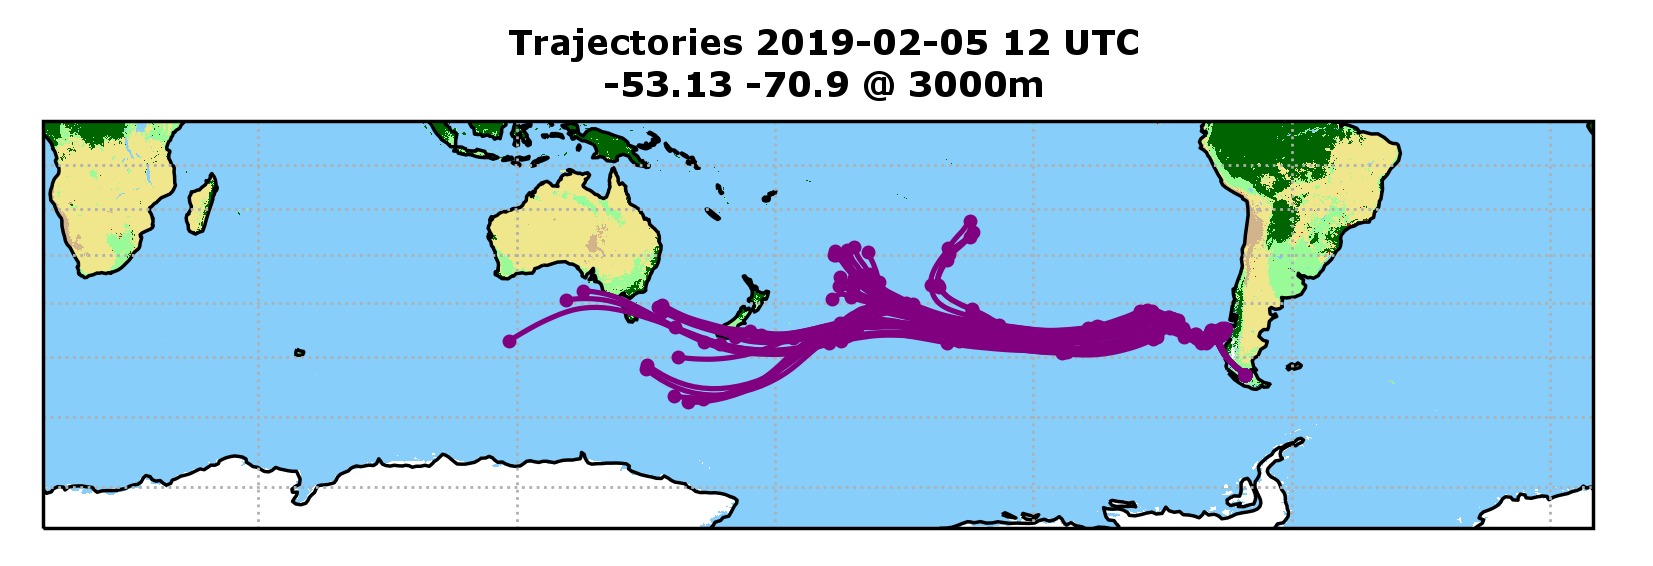
We were not yet able to pin-down the source of this aerosol plume unambiguously. Two source regions are possible: either the forest fires in the Region of Araucanía in Chile or the fires on Tasmania, Australia. Simulations with the HySPLIT (https://www.ready.noaa.gov/HYSPLIT.php) trajectory model (a model that traces the pathway of air parcels), show that the airmass, which was at Punta Arenas in 3km height on Tuesday 12 UTC (9 local) crossed both region during the prior 10 days. We are thus looking forward to have to solve yet another research puzzle.
[mr]