As previously mentioned (here and here), the LACROS instruments also observe profiles of the (quite variable and particularly strong) horizontal wind over Punta Arenas. Within the atmospheric boundary layer - the lowermost part of the Troposphere - the HALO Photonics Streamline Doppler lidar [manufacturer website] is well suited to observe winds. Our system is nicknamed 'Shaun' and it is shown below.
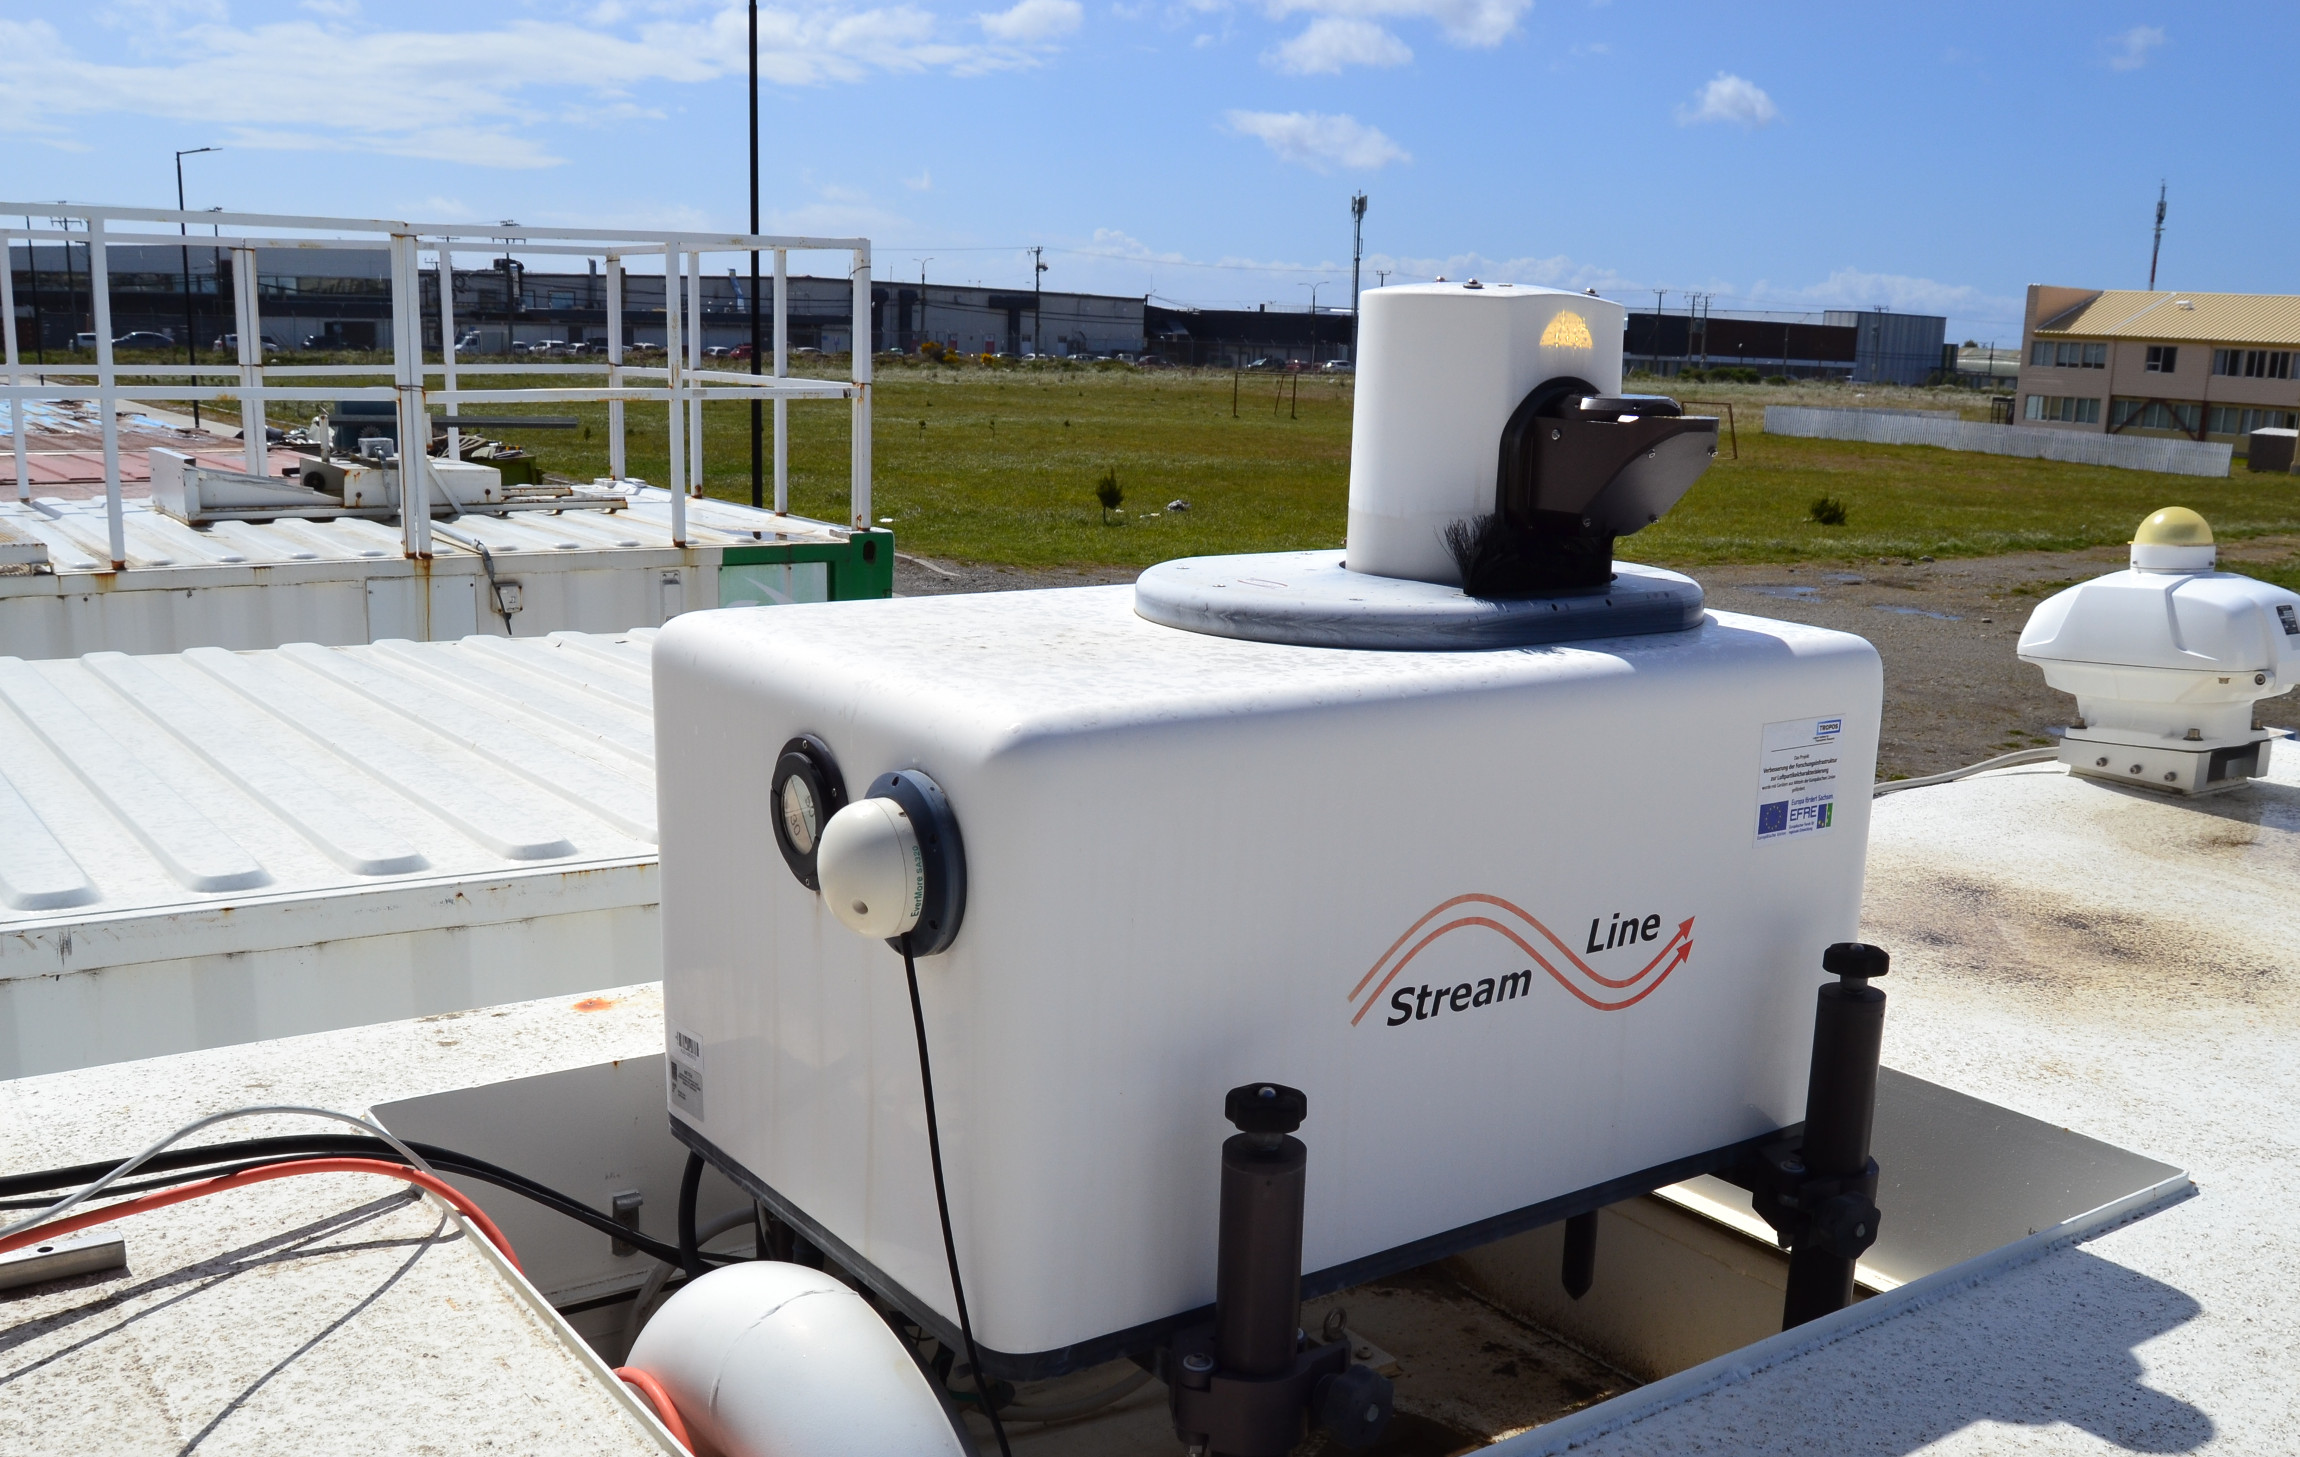
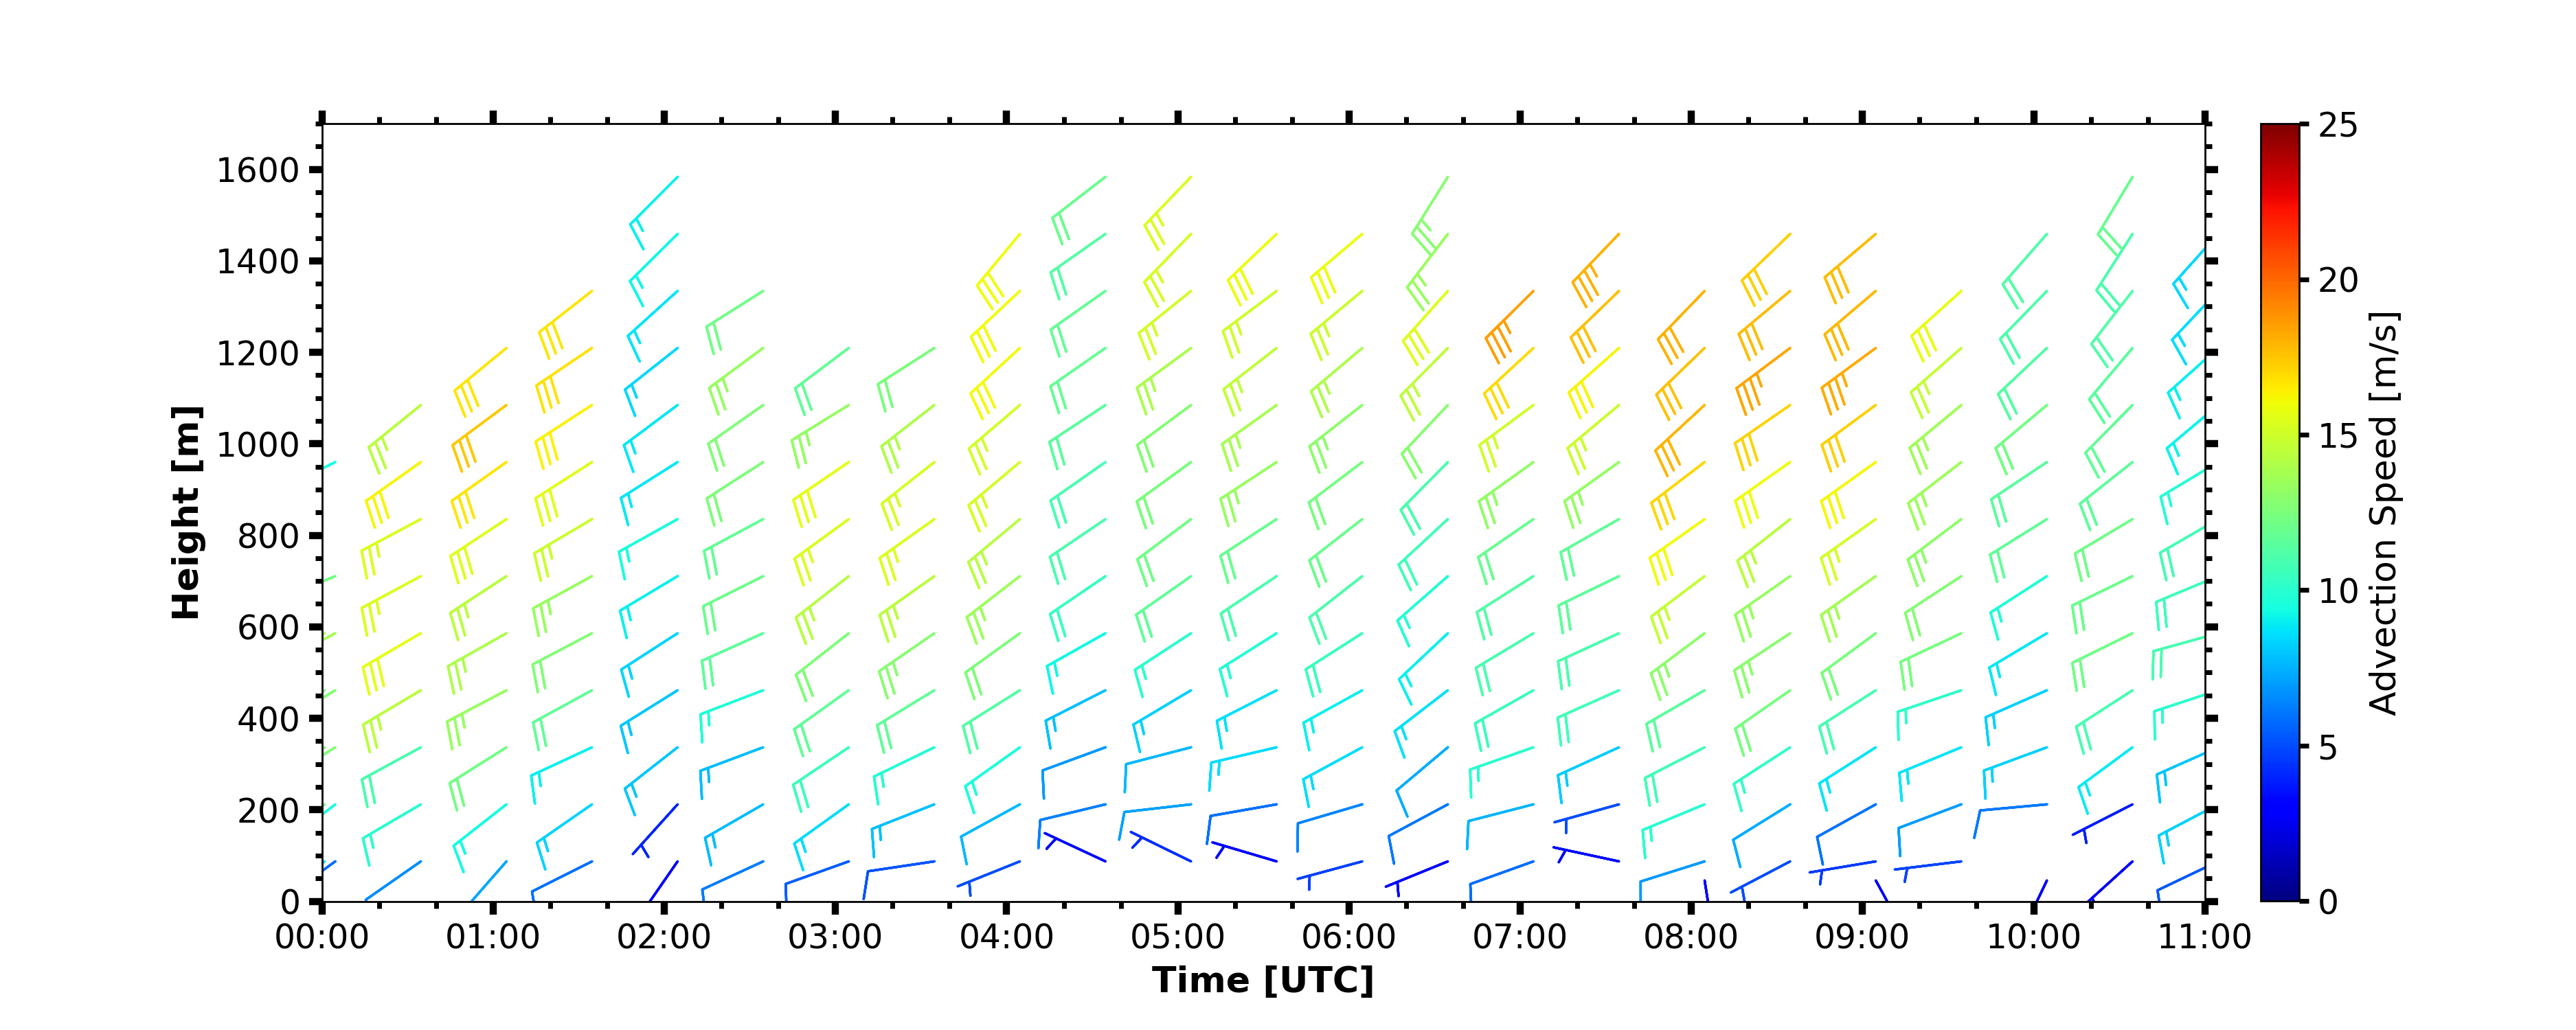
Due to its scanning head, it can observe profiles of either vertical velocity or horizontal wind. The latter is derived from azimuth scans at a fixed elevation, in our case 60°. An estimate of horizontal wind speed and direction is then available for every scan with a vertical resolution of 41m. During DACAPO-PESO such scans were performed every 30 minutes. To obtain a signal form the atmosphere, this type of Doppler lidar needs particles that scatter the light of the laser beam (wavelength 1.55 um). In the atmospheric boundary layer enough small aerosol particles are present to provide signal. A typical measurement is shown below (click on the image to enlarge). It shows the retrieved horizontal wind during the first half of 3rd Dec 2019. As the scans were performed every 30 minutes, there are two profiles each hour (theoretically more frequent scans can be performed, but for our cloud research we are also interested in the vertical velocity observations performed between the scans). The wind speed and direction are displayed as 'wind barbs'. To simplify interpretation not all height-levels are shown in this plot. But, can be seen that the profiles cover the horizontal wind from a few meters above the surface up to 1.6km height with the lowest wind speeds close to the surface and stronger winds aloft (especially between 07 and 09 UTC above 800m).
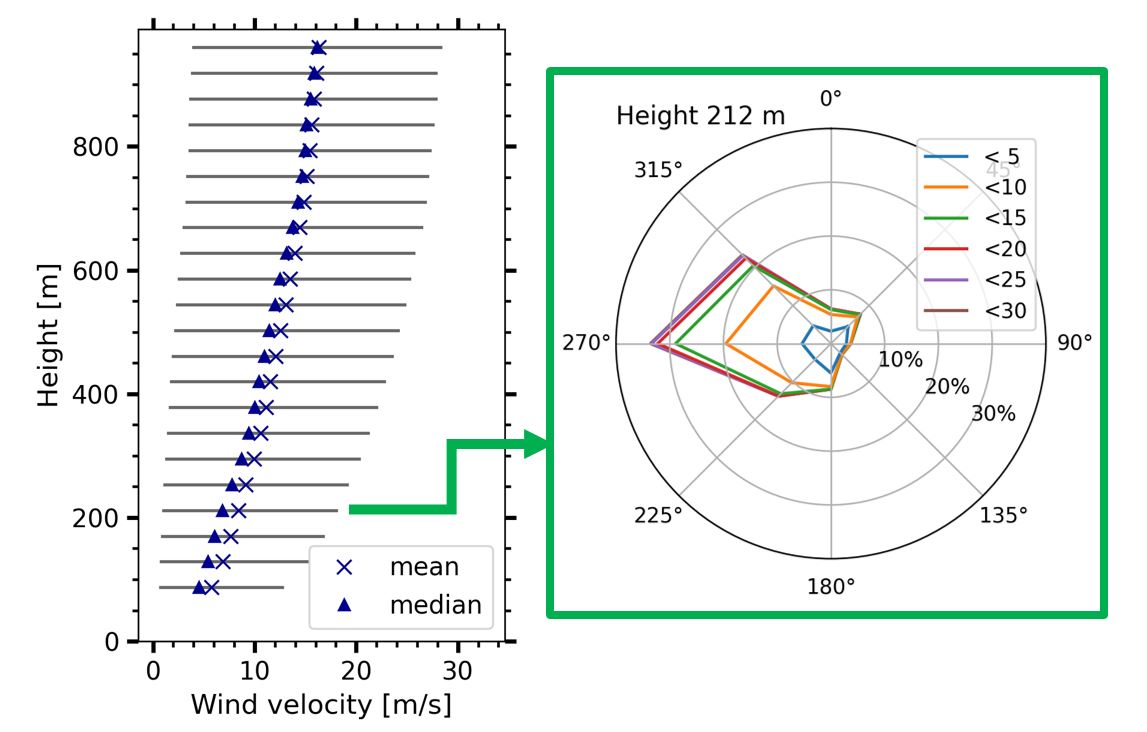
With the 3-year dataset at hand it is now possible to derive some long-term statistics of the wind field. For now, just focus on the 1-year period from November 2019 to November 2020. During that period more than 16014 profiles were observed. The average profile of horizontal wind speed is shown on the left hand side below. As expected, the values increase with height. Also the distribution is skewed to the right (mean larger than median). For each height a histogram over direction and velocity can be computed. Here, the height of 212m is shown. Northerly and north-westerly winds are the most frequent ones, with less than 5% of the observations for each direction having less than 5m/s. Winds above 10m/s exclusively occur from westerly directions.
The statistics shown here, are only a very first glimpse into the data. The high temporal and vertical resolution, compared to traditional radiosondes or tower observations allows to address more detailed research questions. Diurnal and annual cycles can be investigated, as well as the presence of low-level-jets and the connection of extreme winds to specific meteorological conditions.
[mr]