Last Friday and Saturday, the wind here in Punta Arenas was extreme, even for the local standard. It might not have been the perfect time to arrive here via airplane, but on the other hand, the landing was a real experience, something to remember later on. A striking thing about the weather situation was the heavy, stormy wind in connection with bright sunshine. Looking out of the window, you wouldn’t imagine almost being blown off the street when going out for dinner. The wind also wasn’t very cold, so being outside was actually quite enjoyable.
The Centro Meteorologico Maritimo reported a maximum wind speed of 58.2 knots, or 108 km/h. On social media, people shared the experiences they had with the unusually strong wind: Windows were broken and power outages were reported in parts of the city. Someone uploaded a video from an airplane landing on Saturday, in which one can see a little bit of the swaying of the plane, followed by a rather rough landing.
Lots of flights were canceled on Saturday and consequently, there was a big chaos at the airport. This complicated retrieving my suitcase, which was lost the day before when I flew to Punta Arenas. Luckily, the baggage (which contained some important cables and switches needed for the site) was there on Saturday.
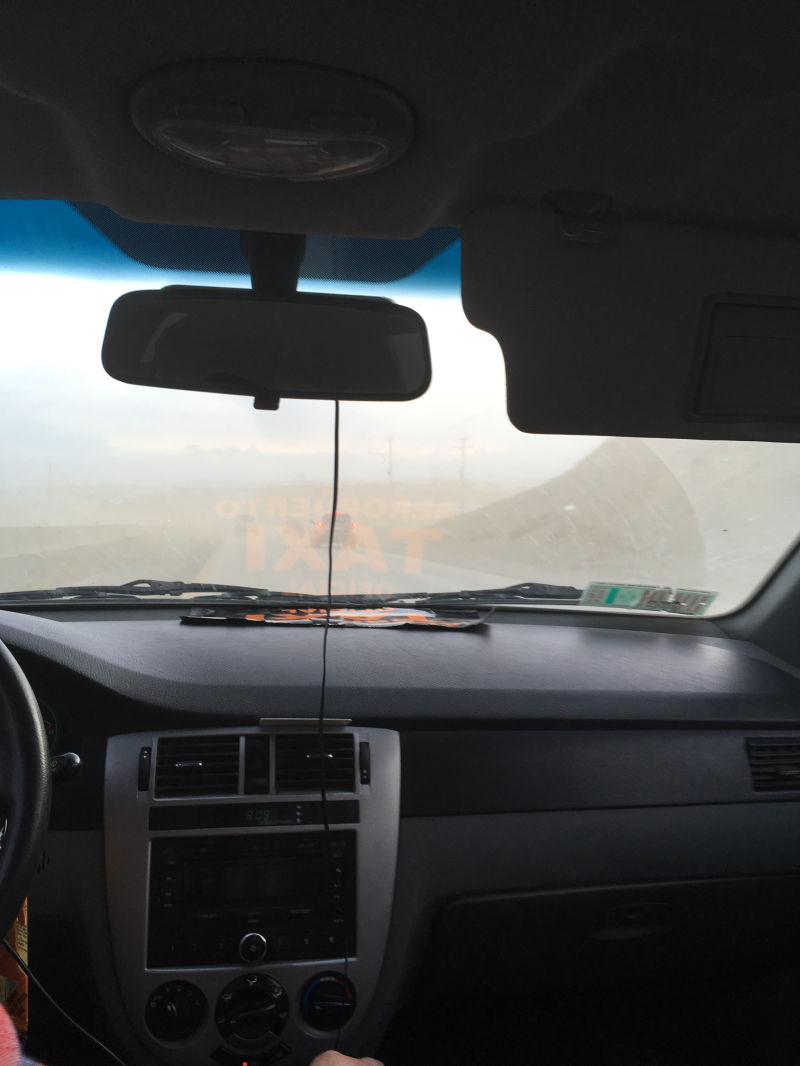
The wind raised quite a lot of dust, which complicated car traffic in addition to the heavy wind gusts. So on top of having to steer against the wind, the view was also obstructed by a thick dust plume from time to time. A truck besides the road was actually overturned. Riding the taxi on the way from/ to the airport was quite exciting:
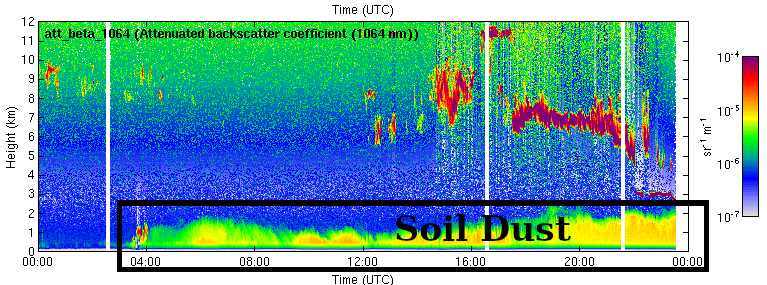
We can also see this dust in our lidar data. The dust stays in the lower atmosphere, below 2 km altitude, as can be seen in the POLLY backscatter (1064 nm).
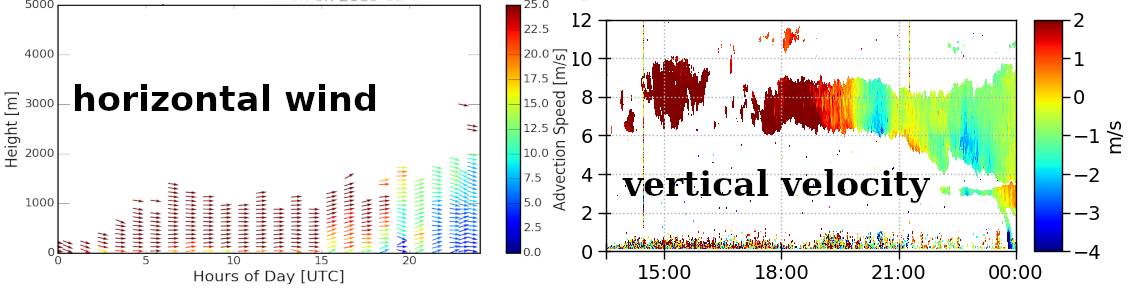
When checking our remote sensing data, we noticed that we cracked some of the standard color scales in our quicklook plots: The Shaun wind lidar quick look plots show only dark red arrows during the first half of February 16, starting in the second height bin. Below, surface friction slows down the wind at least a little bit so that it’s “only” around 20 m/s, or 70 km/h. Shaun measures the horizontal and vertical wind. In the graph below, the left panel shows the horizotal wind. Vertical wind was exceptionally high as well, which can be seen in the radar data: The Doppler velocity, which can be translated to the combined vertical wind + fall velocity of cloud particles, is shown in the left panel below. Also here, the color scale is not wide enough to accommodate the vertical wind speeds of sometimes almost 4 m/s:
Both graphs show the time on the horizontal axis and the height in the vertical coordinate. The color scale depicts the wind speed. Red means very high wind velocities.
[TV]